disaster costs rising significantly
I don’t see the information below as a scientific exploration of the topic of disaster costs but the numbers do tell a story.
If you want to know why your property insurance is costing more…look to California and other states where disaster losses are mounting!
See information sent to me below:
“California’s disaster costs surged 2,900% in one year, jumping from $2.5B in 2024 to $75.0B in 2025, according to Barcus Arenas’ Storm Stress Index. That makes California the clearest disaster-cost outlier in the country, even though Texas faced more frequent billion-dollar events.
Barcus Arenas, PLLC, analyzed state-level billion-dollar disaster cost data and found a sharp split in America’s risk map: Texas shows frequency risk, while California shows severity risk. The finding is urgent because one catastrophic wildfire season can create more financial damage than repeated storms elsewhere, leaving property owners, insurers, and businesses facing a much longer recovery fight.
Key Findings:
California costs jumped 2,900% YoY.
California rose from $2.5B to $75.0B.
California carried 65.2% of the 2025 costs.
Texas ranked second at $12.5B.
Alabama costs rose 133% YoY.
Indiana costs rose 116% YoY.
Data Table: Costliest Storm States by Disaster Costs
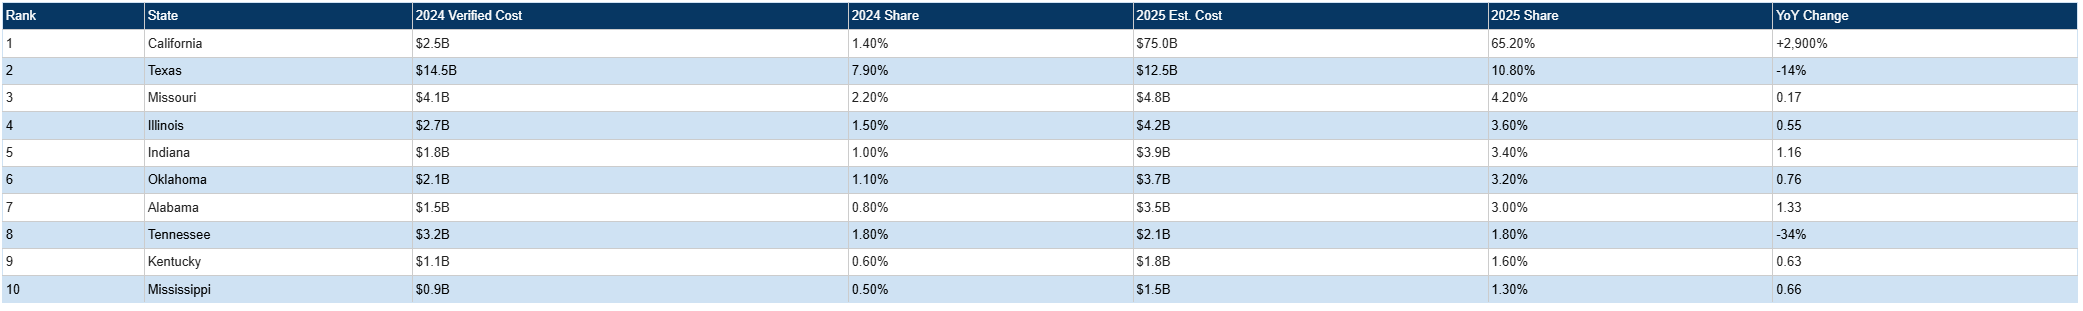
What This Data Reveals:
California shows how one disaster can change everything. Its disaster costs jumped from $2.5B in 2024 to $75.0B in 2025, a 2,900% increase. California was not hit by the most events, but one severe wildfire season created the biggest financial burden in the country.
The number of disasters does not always show the real risk. Texas ranked second in costs at $12.5B, even though it faced more frequent disaster exposure. California carried 65.2% of the 2025 cost burden, showing that one extreme event can do more financial damage than repeated storms elsewhere.
For property owners and businesses, the costs do not stop when the fire is out. A $75.0B disaster burden can mean closed buildings, lost revenue, delayed repairs, insurance inspections, claim disputes, and rebuilding costs. The recovery can last months or years after the headlines fade.
The bigger warning is how quickly costs are rising in multiple states. Alabama’s costs rose 133%, Indiana’s rose 116%, Oklahoma’s rose 76%, and Mississippi’s rose 66%. California is the most dramatic case, but the pattern shows more states are facing sudden financial shocks that businesses, insurers, and local communities may not be ready for.
Why This Matters Now
California’s $75.0B disaster-cost burden is still shaping recovery, while 2026 storm and wildfire risks are already building. For residents, businesses, and property owners, the issue is not only what was destroyed, but how long it takes to reopen, rebuild, settle claims, and absorb costs that insurance may not fully cover.
When one state’s disaster costs jump 2,900% in a single year, local leaders, insurers, and property owners face urgent questions about coverage, rebuilding timelines, business interruption, and financial readiness. The next major fire or storm could arrive before many communities have fully recovered from the last one.
Methodology
Barcus Arenas analyzed 2024 and 2025 state-level billion-dollar disaster cost data, comparing each state’s verified 2024 costs with estimated 2025 midpoint costs. Cost shares reflect each state’s portion of the analyzed national disaster cost burden.”
Data Sources:
Barcus Arenas Storm Stress Index: https://www.barcusarenas.law/research/the-storm-stress-index
Climate Central Billion-Dollar Disasters: https://www.climatecentral.org/report/us-billion-dollar-weather-and-climate-disasters-2025
NOAA Billion-Dollar Disaster Data: https://www.ncei.noaa.gov/access/billions/
CAL FIRE Incident Data: https://www.fire.ca.gov/incidents/
You can find more details in the full study -
https://www.barcusarenas.law/research/the-storm-stress-index/?utm_source=outreach&utm_medium=shared